


Tracking Threat Actors: How Infrastructure Analysis Reveals Cyber Attack Patterns
Tracking Threat Actors: How Infrastructure Analysis Reveals Cyber Attack Patterns

Unmasking Cyber Threats: How Infrastructure Tracking Aids Attribution
The main subject of this article is to present our methods for clustering and identifying the purpose of an infrastructure. The most added value is the cross-referencing between public or private sources of information to create an infrastructure diagram to start producing intelligence and work with it in the long term.
As we see many blog posts about infrastructure tracking, we at Kudelski Security wanted to produce this article to show some methodologies and practical use cases based on internal research.
Decoding Threat Actor Infrastructure: A Case Study in Attribution
For that, instead of taking ‘Indicators of Compromise’ (IOCs) from an incident response, we are going to take a phishing campaign published by the CISA[1] against U.S and Israeli government officials as an example.
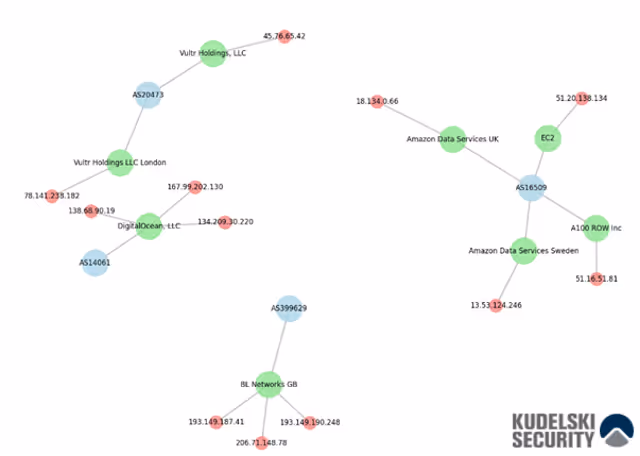
Figure 1: Mapping and enriched IPs from the attack
From the IPs we can see from this campaign, all of them have been attributed to the Iranian group Pioneer Kitten, UNC757. They have conducted numerous intrusions against organizations in the United States and other countries since 2017, with the majority of IPs found on this campaign; most of the IPs are linked to a hosting provider.
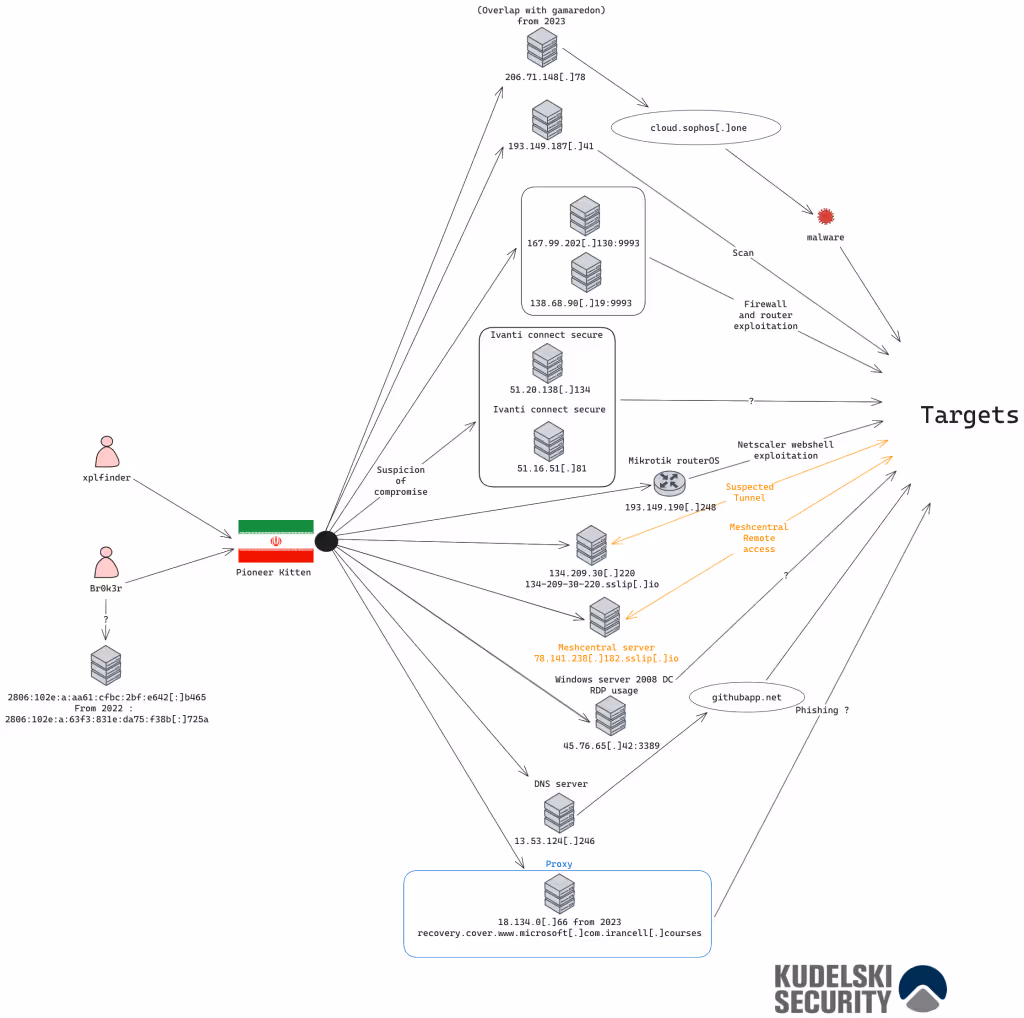
Figure 2: Reconstitution and enriched IOCs from the attack
When investigating an infrastructure like this, it is essential to identify similarities, recurring patterns, pivot points, historical data, and collected telemetry. By analyzing these elements, we can establish connections between different attack campaigns and uncover insights into the threat actor’s tactics, techniques, and procedures (TTPs). While we cannot provide an exhaustive breakdown here, leveraging structured intelligence sources enables a more comprehensive resource[2].
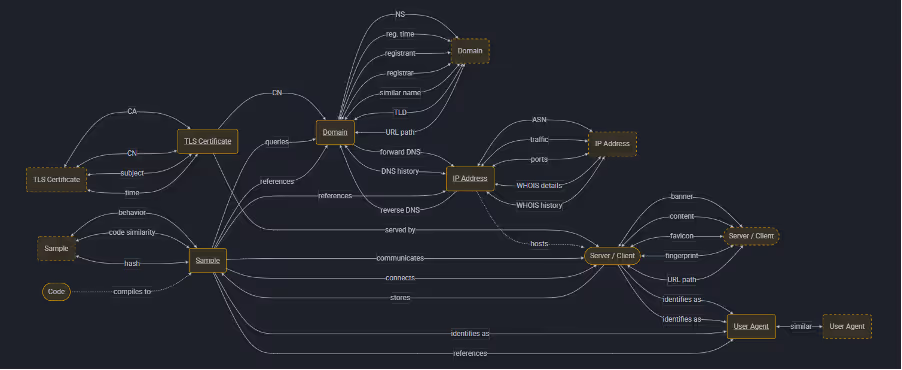
Figure 3: Plan from https://gopivot.ing/map/
During our investigation, we identified a potential overlap with Gamaredon by pivoting on historical DNS data. In August 2023, the domain hopers[.]ru was observed resolving to 206.71.148[.]78, a finding initially reported on the social media platform X.[3] Similarly, in this attack, Pioneer Kitten used the domain cloud.sophos[.]one to deliver malware, pointing to the same IP address. This pattern of infrastructure reuse underscores the importance of tracking historical data to map threat actor behaviors and identify operational connections.
After the collection phase, we need to save the findings in a cluster under a naming convention in case we can’t attribute them; it will save us some time in our future investigations if we find an infrastructure that overlaps with our previous findings.
A foundational framework in Cyber Threat Intelligence (CTI), the Diamond Model provides a structured approach to analyzing adversaries and their intrusions by examining four key elements. This model can be stored in an open CTI platform or a dedicated database—what matters most is ensuring it remains easily accessible for future analysis. The true value lies in its long-term utility, allowing analysts to continuously monitor, correlate, and exploit key indicators over time to refine attribution and strengthen threat intelligence efforts.
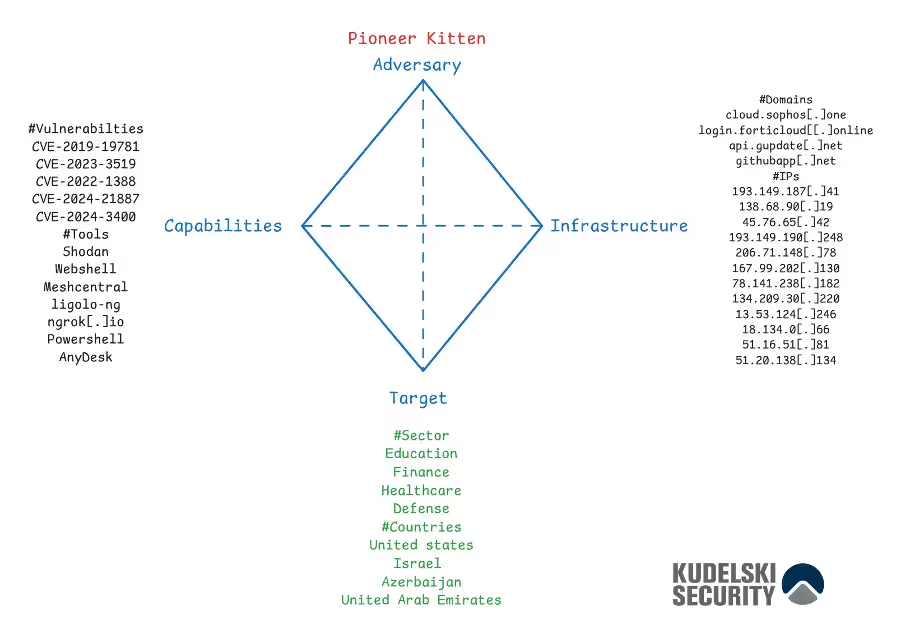
Figure 4: Diamond model of the assessed attack
Tracking Digital Footprints: Mapping and Clustering Malicious Infrastructure
Effective infrastructure analysis requires meticulous documentation, regardless of whether the infrastructure is confirmed as malicious. Threat actors frequently reuse networks, tools, and even operational mistakes, making historical records a valuable asset for tracking evolving tactics. By maintaining structured intelligence, analysts can efficiently identify overlaps, detect recurring patterns, and accelerate future investigations.
To illustrate this process, we will outline a two-step approach to clustering different infrastructures, using intelligence gathered from a leak related to North Korean IT workers as a case study.
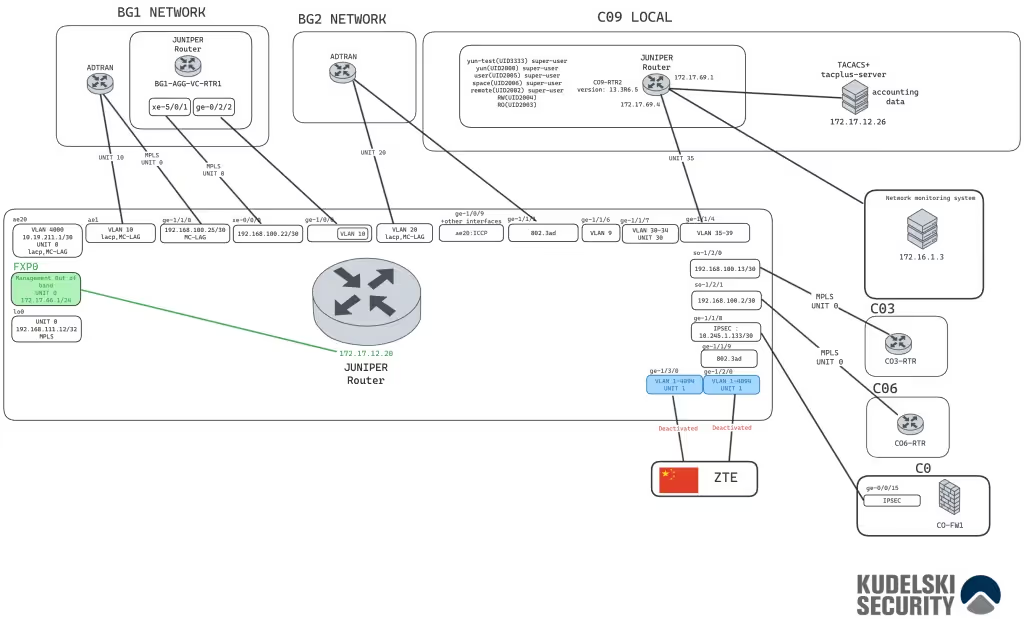
Figure 5: Reconstituted infrastructure from North Korean IT workers
Using a PuTTY configuration file as a source[4], we have reconstructed a complete infrastructure. While its exact purpose remains unclear, our analysis—based on available intelligence—suggests the following:
- The infrastructure seems to be a part of a wide area network (WAN)
- This part of the network is probably in Kaesong, North Korea. According to the files, the infrastructure is linked to “ZTE”; the links were cut just after their creation, which let us think about the relation to the internet restrictions inside of North Korea.
- This infrastructure can be in another country and can be not related to North Korea, IT workers used to work outside of North Korea.[5]
Now that we have linked the network areas, units, and technologies used, we can begin to tag the infrastructure; according to your organization, you must use a naming convention, but for this article, we will do it in a simple way: [NK-NET-LC-08282024-CL-01]
NK: Country code according to the ISO 3166-1
NET: Type of infrastructure or attributed entity, “NET” for network
LC: Confidence level – This one stand for Low Confidence
08282024: Made the first time at the following date MMDDYYYY
CL: Analyst
01: Tag number of the infrastructure for each update add a new version with 01.1 -> 01.2 etc..
The infrastructure may not be exact, but the most important thing is to get as close as possible to the adversary infrastructure.
This serves as an example of how tagging can be used to categorize an unknown infrastructure. We strongly recommend storing this data securely, ensuring it remains easily accessible for future reference. Over time—whether months or even years later—new findings may reveal overlaps with previously identified infrastructures, providing valuable context and strengthening long-term threat analysis.
Next, we are going to put all the pieces together based on past data and findings.
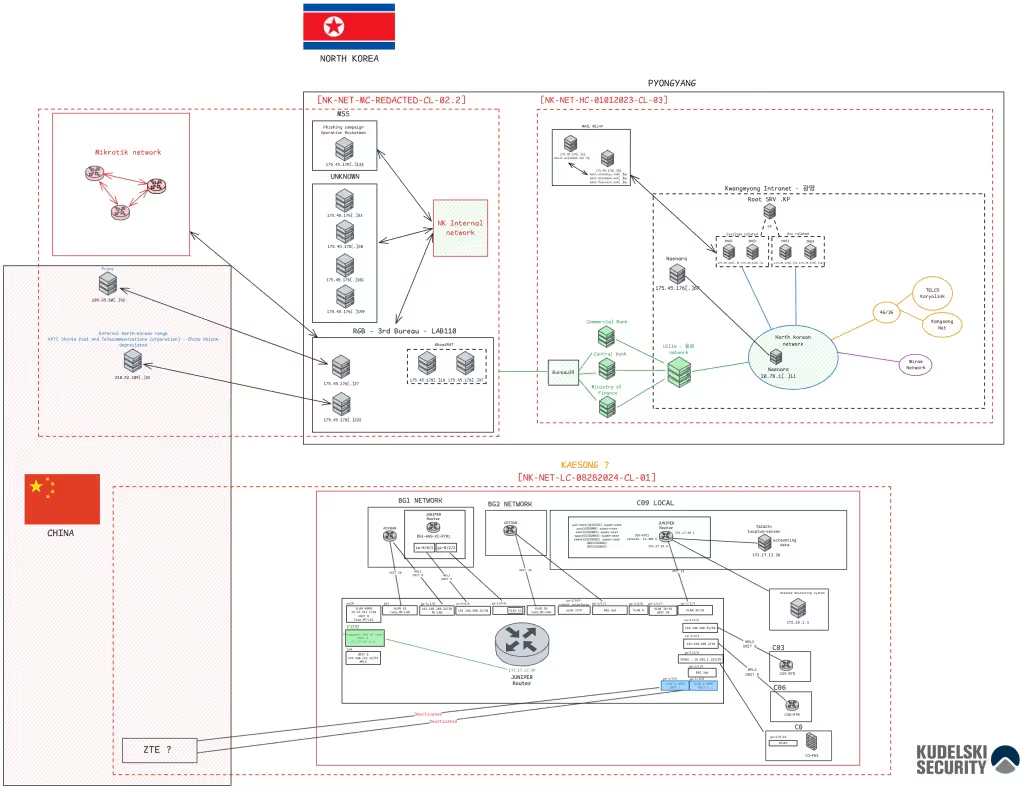
Figure 6: Complete mapping of a North Korean infrastructure
While this example uses fabricated dates, it highlights a fundamental principle in threat intelligence—piecing together disparate infrastructure elements can reveal a more comprehensive picture of an adversary’s network.
Over time, continuous analysis allows intelligence teams to refine their assessments, identify behavioral overlaps, and track the evolution of threat actor infrastructure.[6][7][8] As seen in Mandiant’s reporting, the mapping of North Korean cyber operations has evolved significantly from 2022 to 2024, reinforcing the importance of long-term monitoring and iterative intelligence gathering.
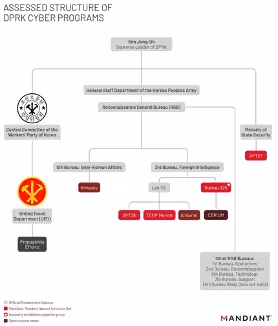
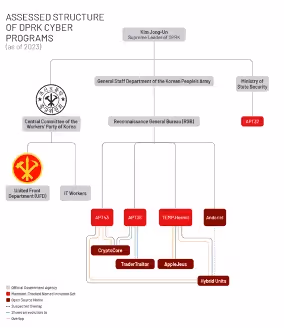
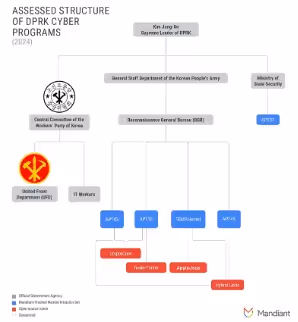
Figure 7: Assessed structure of DPRK Cyber programs from Mandiant
If an analyst plans to adjust his infrastructure knowledge base with open-source data, he must acknowledge that some companies have different naming conventions for the same identified actors with naming groups by regions and subgroups terminologies; as an Intelligence analyst, it’s hard to track, this is due to multiple reasons, security companies track intrusion sets or threat actors without publishing them[9] and they need to use a naming convention to classify them, as we saw before. It can also be used for branding reasons, so security companies publish their documentation with their own naming conventions and get more people used to it. For example, the “APT” (Advanced Persistent Threat) designation has become a widely accepted naming convention for threat actors known for employing sophisticated, sustained attack techniques.
The lack of standardized naming conventions in threat intelligence stems from multiple factors.[10] Each intelligence provider brings a unique perspective on malicious infrastructure, malware, clusters, TTPs (Tactics, Techniques, and Procedures), IOCs (Indicators of Compromise), and the sharing of toolsets between different threat actors. Shifting alliances, operational overlaps, and evolving adversary behaviors further contribute to these variations, leading to discrepancies in how different intelligence teams classify and track threats.[11][12]
One key challenge is that attribution can vary significantly between intelligence providers. For instance, one provider may classify a single entity as a distinct threat actor, while another may interpret the same activity as belonging to multiple actors. These differences are often shaped by the methodologies, data sources, and investigative techniques used—ultimately influencing how adversary groups are identified and named.
To analyze an infrastructure based on open-source data, the analyst has to make sure to see each intelligence provider with a different point of view, and everything counts:
- The country of the source in the geopolitical context of the attributed adversary. The data in the article can be provided by a state for political reasons, and it can affect the data ingested by the analyst when he tries to make marks on time to correlate it with geopolitical analysis.
- The comparison between different sources, crossing data and findings between multiple intelligence providers.
- The attribution part must be validated by the analyst reviewing the report shared by the intelligence provider.
Connecting the Dots: How Threat Intelligence Unveils Cyber Adversaries
The activity matrix[13] aims to have a clear view of an organization, a specific operation or a campaign monitored by an intelligence team. Let’s take the Lazarus group for this one.
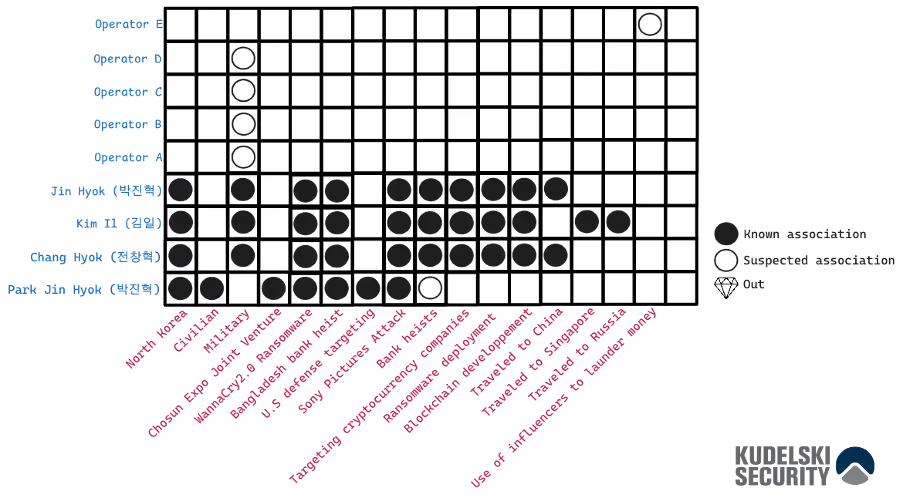
Figure 8: North Korean activity matrix
Most of the data come from the DOJ press release except for the “Operator A, B, C, D, E which is a generated data for the example
In threat intelligence analysis, a diamond symbol is often used within the matrix to denote an individual or entity that is no longer active. This structured approach helps analysts map an attacker’s organization, identify operational hierarchies, and detect both common and anomalous patterns within their tactics.
In this particular matrix, the U.S. Department of Justice (DOJ) serves as the sole data source, allowing us to distinguish between civilian and military operations conducted by known members of the Lazarus Group. Additionally, analyzing travel patterns can reveal key insights, such as identifying countries that may serve as proxy residences for operatives conducting cyber-attacks against their intended targets.
Sources
[1] https://www.cisa.gov/sites/default/files/2024-08/aa24-241a-iran-based-cyber-actors-enabling-ransomware-attacks-on-us-organizations_0.pdf
[2] https://gopivot.ing/
[3] https://x.com/cyber0verload/status/1694448759055306800
[4] https://x.com/Bizarredect/status/1828750064673849389
[5] https://www.justice.gov/opa/pr/two-north-korean-nationals-and-three-facilitators-indicted-multi-year-fraudulent-remote
[6] https://cloud.google.com/blog/topics/threat-intelligence/mapping-dprk-groups-to-government/?hl=en
[7] https://cloud.google.com/blog/topics/threat-intelligence/north-korea-cyber-structure-alignment-2023/?hl=en
[8] https://cloud.google.com/blog/topics/threat-intelligence/apt45-north-korea-digital-military-machine?hl=en
[9] Attribution of advanced persistent threat; page 30
[10] https://cyb3rops.medium.com/the-newcomers-guide-to-cyber-threat-actor-naming-7428e18ee263
[11] https://docs.google.com/spreadsheets/d/1H9_xaxQHpWaa4O_Son4Gx0YOIzlcBWMsdvePFX68EKU
[12] https://github.com/StrangerealIntel/EternalLiberty
[13] https://www.marines.mil/Portals/1/Publications/MCWP%202-6%20W%20Erratum%20Counterintelligence.pdf
.webp)